You have data. Plenty of it.
- Google Analytics
- Search Console
- Your affiliate dashboard
- Email open rates
- Click-through rates
- Conversion percentages
The problem isn’t a lack of data.
It’s not knowing what it’s telling you.
Most affiliate marketers fall into one of two traps.
They either ignore their numbers entirely and run on gut feel.
Or they stare at dashboards for hours, see patterns that may or may not be real, and still don’t know what to do next.
AI solves both problems.
You don’t need to become a data analyst. You need to know how to ask the right questions — and let AI do the interpretation.
This article gives you six prompts that turn raw numbers into clear decisions.
You may also like:
- Business Plan Development (Using AI as Your Strategic Thinking Partner)
- How to Make AI Write in YOUR Voice
- How to Write Product Reviews Using AI (Without Sounding Robotic)
Why Most People Can’t Use Their Own Data

Data doesn’t speak for itself. It needs context, comparison, and interpretation.
The raw numbers problem: A 2.3% conversion rate means nothing without knowing if that’s good or bad for your niche, traffic source, and offer type.
The correlation trap: Traffic went up the same month you changed your headlines. Did the headlines cause the traffic increase? Maybe. Or maybe it was a seasonal trend. Raw data can’t tell you which.
The action gap: Even when you understand what happened, knowing what to do about it is a different skill entirely.
AI bridges all three gaps — if you give it the right context and ask the right questions.
The key rule: Never just paste numbers into AI and ask “what does this mean?” That produces generic observations. Give AI your numbers, your goals, your context, and your specific question. That produces actionable insight.
The C.L.E.A.R. Method for Data Analysis
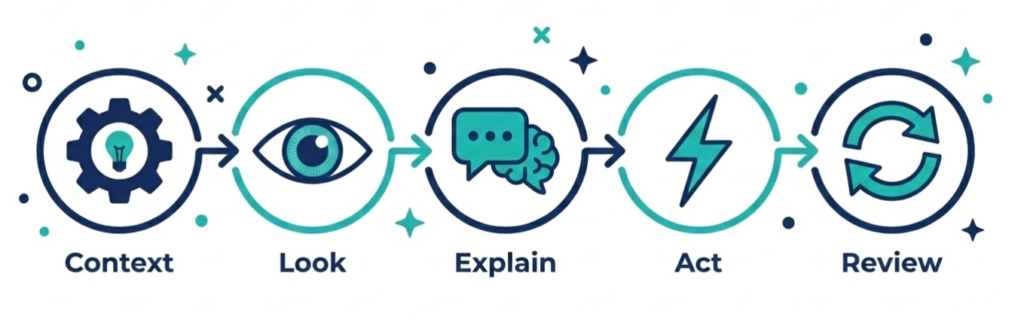
Five steps that turn any dataset into a decision.
C — Context: Tell AI what the numbers are measuring and what you’re trying to achieve.
L — Look: Ask AI to identify what stands out — patterns, anomalies, and trends.
E — Explain: Ask AI to explain why those patterns might exist.
A — Act: Ask AI to turn the explanation into specific next steps.
R — Review: Set a timeframe and metric to test whether the action worked.
Let’s run through it with real prompts.
C — Context: Set the Stage
Raw numbers without context are noise. This step turns noise into signal.
Prompt 1: The Data Context Setter
Before you ask AI to analyze anything, give it the full picture.
I'm going to share some data with you. Before you analyze it, here's the context:

MY BUSINESS: [brief description — niche, content type, monetization model]
MY GOAL: [what I'm trying to achieve — e.g. increase affiliate revenue, grow email list]
TIME PERIOD: [what dates the data covers]
TRAFFIC SOURCE: [where visitors come from — organic search, social, email, etc.]
CURRENT SITUATION: [anything unusual — recent changes, seasonality, new content published]

Here is the data: [paste your numbers]

Do not analyze yet. First, tell me:
1. What additional context would help you give better analysis?
2. What are the limitations of drawing conclusions from this data alone?
3. What comparison data would make this more meaningful?
This prompt does something most people skip — it finds the gaps in your data before you start drawing wrong conclusions from incomplete information.
L — Look: Find What Stands Out
Now ask AI to scan the data with fresh eyes.
Prompt 2: The Pattern Spotter
Here is my data with full context: [paste Prompt 1 setup + your data]

Scan this data and identify:

1. ANOMALIES — anything that doesn't fit the overall pattern
   (sudden spikes, unexpected drops, outliers)

2. TRENDS — directional movements over time
   (growing, declining, plateauing)

3. CORRELATIONS — metrics that seem to move together
   (traffic up when X happens, conversions down when Y changes)

4. GAPS — what's missing or underperforming relative to expectations

5. BRIGHT SPOTS — what's working better than the rest

For each finding, describe what you see in plain language.
No explanations yet — just tell me what you notice.
Separating observation from explanation is deliberate. If you combine them, AI starts inventing reasons for patterns before confirming the patterns are real.
E — Explain: Understand Why
Patterns are interesting. Causes are useful.
Prompt 3: The Root Cause Analyst
Here are the patterns you identified in my data: [paste Prompt 2 output]

For each pattern, give me:

1. THE MOST LIKELY EXPLANATION
   — What probably caused this based on the data and context?

2. ALTERNATIVE EXPLANATIONS
   — What else could explain this? (list 2-3 alternatives)

3. WHAT WOULD CONFIRM IT
   — What additional data or test would prove which explanation is correct?

4. CONFIDENCE LEVEL
   — How confident should I be in the most likely explanation?
   (high / medium / low — and why)

Be honest about uncertainty. I'd rather know "this is unclear" than be given a confident wrong answer.
That last instruction matters. AI tends toward confident-sounding answers. Explicitly asking it to flag uncertainty produces more honest, useful output.
A — Act: Turn Insight into Decision

Understanding your data is only useful if it changes what you do.
Prompt 4: The Action Generator
Based on this data analysis: [paste findings so far]

My biggest priority right now is: [state your #1 goal]
My available time per week is: [hours]
My biggest constraint is: [time / traffic / content / technical ability]

Generate specific actions I should take, organized by:

QUICK WINS (can do this week, low effort):
— What small changes are most likely to improve results fast?

MEDIUM TERM (next 30 days, moderate effort):
— What content, copy, or structural changes should I prioritize?

LONGER TERM (60-90 days, higher effort):
— What strategic shifts does this data suggest I should be making?

For each action:
- State exactly what to change
- Explain what metric it should improve
- Give me a way to measure whether it worked
Organize actions by effort and timeframe. Not everything the data suggests is equally urgent or equally achievable. This prompt forces prioritization.
Prompt 5: The Conversion Debugger
This prompt is specifically for when your traffic looks fine but revenue doesn’t follow.
Here is my traffic and conversion data: [paste data]

My traffic sources: [organic / social / email / paid]
My current offers: [list affiliate products or services]
My content-to-offer flow: [describe how readers move from content to offer]

Diagnose my conversion problem by checking each stage:

1. TRAFFIC QUALITY — is the traffic actually relevant to my offer?
2. CONTENT-OFFER MATCH — does my content naturally lead to this offer?
3. TRUST SIGNALS — does my content establish enough credibility before asking for action?
4. FRICTION POINTS — where might readers drop off before converting?
5. OFFER CLARITY — is it obvious what I'm recommending and why?

For each stage: rate it (strong / weak / unclear) and suggest one specific fix.
Most conversion problems aren’t traffic problems. They’re funnel problems. This prompt finds exactly where the leak is.
R — Review: Close the Loop
Acting on data is only half the job. Reviewing whether the action worked closes the loop.
Prompt 6: The Before/After Evaluator
Run this 30 days after implementing changes from Prompt 4.
30 days ago I made these changes based on my data analysis:
[list the changes you made]

Here is my data before the changes: [paste old data]
Here is my data after the changes: [paste new data]

Evaluate:
1. Did the changes produce the expected improvement?
2. Which changes had the biggest impact?
3. Which changes had little or no effect?
4. Did anything unexpected happen — positive or negative?
5. What does this tell me about my next move?

Based on this evaluation, what should I do more of, less of, and differently?
This prompt turns one-off analysis into a learning system. Each cycle gives you better data, better decisions, and better results.
What Data to Actually Track
Most affiliate marketers track too much and act on too little.
Start with these six numbers. Nothing else matters until you understand these fully:
Traffic: Total monthly visitors. Is it growing, flat, or shrinking?
Top pages: Which 20% of content drives 80% of your traffic?
Traffic source breakdown: Where are visitors coming from? Which source converts best?
Conversion rate: What percentage of visitors take your desired action?
Revenue per visitor: Total revenue divided by total visitors. This single number tells you the health of your entire funnel.
Email opt-in rate: If you’re building a list, what percentage of visitors subscribe?
Once a month, paste these six numbers into AI with Prompt 2 (Pattern Spotter). You’ll spend 15 minutes and walk away knowing exactly what to focus on.
Common Data Analysis Mistakes
Mistake 1: Analyzing too early
Symptoms: Drawing conclusions from two weeks of data. Making big changes based on small samples.
Fix: Wait for statistical significance. For most affiliate sites, that means at least 30 days and 500+ visitors per page before drawing firm conclusions.
Mistake 2: Tracking vanity metrics
Symptoms: Celebrating page views while ignoring conversion rate. Traffic going up, revenue staying flat.
Fix: Always connect metrics to money. If a metric doesn’t eventually connect to revenue or list growth, stop tracking it.
Mistake 3: Analyzing without a question
Symptoms: Spending an hour in Google Analytics and leaving with nothing actionable.
Fix: Before you open any dashboard, write down one specific question you want answered. Then use the prompts in this article to answer it.
Mistake 4: Making one change at a time slowly
Symptoms: Taking six months to test three things. No momentum. Can’t connect cause to effect.
Fix: Use Prompt 4 to batch your changes into sprints. Test in 30-day windows. Review with Prompt 6. Repeat.
The Bottom Line
Your data already contains the answers to your biggest growth questions.
You just haven’t been asking it the right questions.
The C.L.E.A.R. method — Context, Look, Explain, Act, Review — turns any dataset into a decision cycle. The six prompts give you the exact questions to ask at each stage.
You don’t need to become a data analyst. You need to become someone who knows how to have a productive conversation with their numbers.
AI makes that possible for anyone.